By using this site, you agree to our Privacy Policy and Terms of Service.
Accept
Absolute Geeks UAEAbsolute Geeks UAE
  • STORIES
    • TECH
    • AUTOMOTIVE
    • GUIDES
    • OPINIONS
  • REVIEWS
    • READERS’ CHOICE
    • ALL REVIEWS
    • ━
    • SMARTPHONES
    • CARS
    • HEADPHONES
    • ACCESSORIES
    • LAPTOPS
    • TABLETS
    • WEARABLES
    • SPEAKERS
    • APPS
  • WATCHLIST
    • TV & MOVIES REVIEWS
    • SPOTLIGHT
  • GAMING
    • GAMING NEWS
    • GAME REVIEWS
  • +
    • OUR STORY
    • GET IN TOUCH
Reading: ChatGPT supercharges data analysis with cloud integration and interactive tables
Share
Notification Show More
Absolute Geeks UAEAbsolute Geeks UAE
  • STORIES
    • TECH
    • AUTOMOTIVE
    • GUIDES
    • OPINIONS
  • REVIEWS
    • READERS’ CHOICE
    • ALL REVIEWS
    • ━
    • SMARTPHONES
    • CARS
    • HEADPHONES
    • ACCESSORIES
    • LAPTOPS
    • TABLETS
    • WEARABLES
    • SPEAKERS
    • APPS
  • WATCHLIST
    • TV & MOVIES REVIEWS
    • SPOTLIGHT
  • GAMING
    • GAMING NEWS
    • GAME REVIEWS
  • +
    • OUR STORY
    • GET IN TOUCH
Follow US

ChatGPT supercharges data analysis with cloud integration and interactive tables

GEEK DESK
GEEK DESK
May 17

ChatGPT, the popular AI chatbot, is making waves again with significant enhancements to its data analysis capabilities.This time, the focus is on seamless integration with cloud storage platforms and interactive visualization tools.

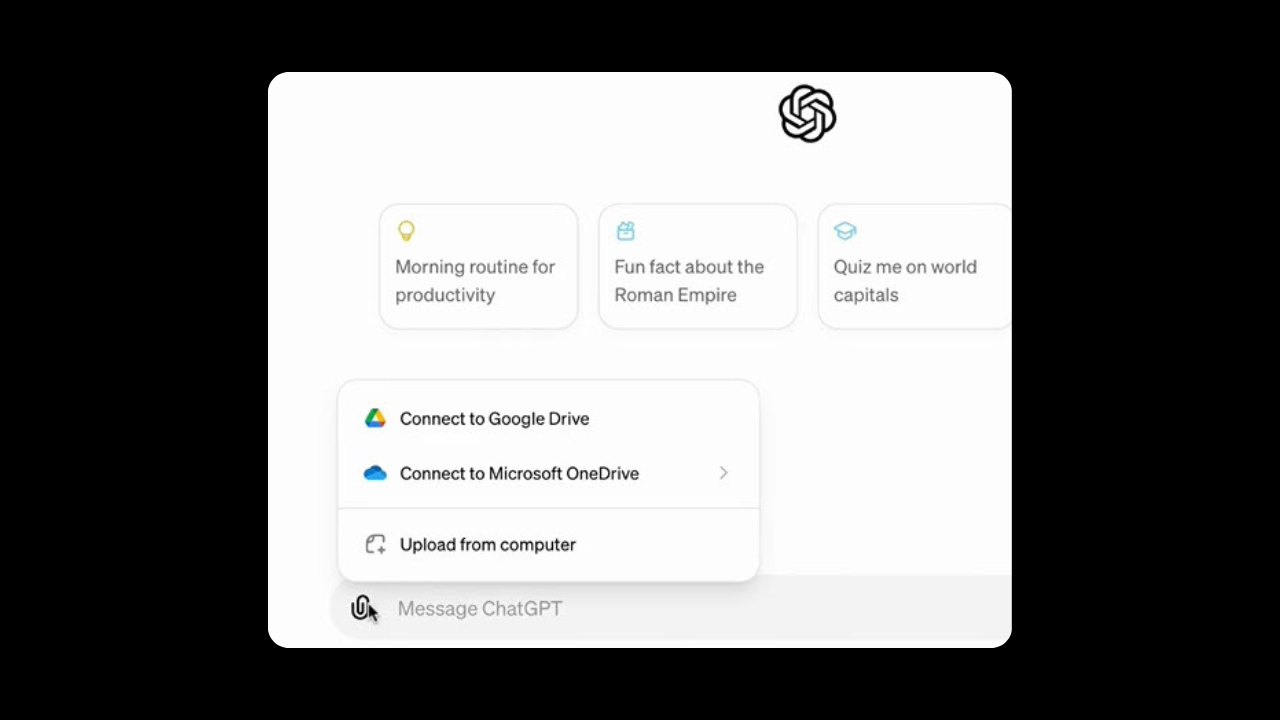
ChatGPT Plus, Team, and Enterprise users can now rejoice as they can directly access and analyze data files stored in Google Drive (Sheets, Docs, Slides) and Microsoft OneDrive (Excel, Word, PowerPoint). This eliminates the tedious process of manual downloads and uploads, streamlining the data analysis workflow.

But that’s not all! Static reports are a thing of the past. ChatGPT now presents data in interactive tables that can be expanded for a more comprehensive view. Users can also click on specific areas to ask follow-up questions, fostering a deeper understanding of the data.

Imagine you’ve uploaded a dataset containing monthly expenses. ChatGPT will automatically generate an interactive table that expands to a full-screen view, allowing you to track changes in real time during your analysis. You can then click on specific cells to ask questions like, “Which expense category increased the most in the last quarter?” or choose from ChatGPT’s suggested prompts to further explore the data.

Furthermore, ChatGPT now offers customizable chart options such as bar, line, pie, and scatter plots. You can hover over elements to explore data points, ask for clarifications, and adjust colors to create visually appealing charts ready for presentations or reports.

These innovative features are powered by the new GPT-4 model and are exclusively available to ChatGPT Plus, Team,and Enterprise subscribers.

Share
What do you think?
Happy0
Sad0
Love0
Surprise0
Cry0
Angry0
Dead0

WHAT'S HOT ❰

Shark CryoGlow LED Mask launches in UAE with cooling under-eye feature
Marvel Tōkon: Fighting Souls reveals new black panther design with Shuri
Charlotte de Belle creates immersive installation in Dubai
OpenAI launches dedicated ChatGPT app for Microsoft Intune users
What’s new in iOS 26.5 RC ahead of public release
Absolute Geeks UAEAbsolute Geeks UAE
Follow US
AbsoluteGeeks.com was assembled during a caffeine incident.
© Absolute Geeks Media FZE LLC 2014–2026.
Proudly made in Dubai, UAE ❤️
Upgrade Your Brain Firmware
Receive updates, patches, and jokes you’ll pretend you understood.
No spam, just RAM for your brain.
Welcome Back!

Sign in to your account

Username or Email Address
Password

Lost your password?